|
be A) The degree of freedom used in this exercise was 6.
C)The calculated chi-square (x^2) value is 79.23 D)My results indicate that it was not a random but is a significant selection of wooly worms E)The worms that were subjected to a positive selection pressure were the ones that were the color green and were in the grass, and the one that were brownish and were in the dirt, because they blend in. The worms that were subjected to a negative selection pressure were the ones that were colorful with colors of red, some with multi-colors in them such as blue,pink. purple. These do not blend into the environment as well as the other. F) This indicates that over time the wooly population will continue to increase for some species, because of their ability to adapt into the environment better, and it will also decrease for some of the wooly's that do not blend in or adapt as well to the environment. But overall the wooly population will maintain somewhat stable. G) The predators eat the worms that are most visible which would be the ones that do not blend into the environment, so they will most likely be selected by the predators. H) Over a long period of time the population would change the worms would start adapting to the environment knowing their way around, how to stay away from the predators. In ten years the community will increase because they'll learn to adapt, so not as many worms will be consumed by the predators.
0 Comments
Species Diversity Lab
1. Identify the parking lot that was the most diverse. Based on your observations during the lab, explain why your prediction in question #1 of the prelab was supported or not supported.
-The student parking lot was the most diverse because it had more of a variety of brands than the staff parking lot. My prediction in number 1 was supported because I thought the first set of animals was most diverse because it had a wider variety of animals than the second set of animals. 2. List the single most abundant species in each set of data, and write a plausible explanation to explain why these are the most abundant species. - The single most abundant specie in the student parking lot was chevy, and the single most abundant specie in the staff parking lot was ford. These are the most abundant species chevy and ford are both old brands with good reputation. 3. Determine the maximum and minimum values for the Shannon Diversity Index in the parking lot you surveyed. -The maximum value for the Shannon Diversity Index in the parking lot survey was chevy and the minimum was dodge and saburu. 4. If you conducted this lab in a shopping mall parking lot, predict whether the Shannon Diversity Index would be high or low, and how it would compare to the school parking lots. -If I did this lab in a shopping mall parking lot the Shannon Diversity Index would be higher. There would be a way bigger variety of brands of cars. 5. If you conducted this lab at a new car dealership, predict whether the Shannon Diversity Index would be high or low, and how it would compare to the school parking lots. -If I did this lab at a new car dealership the Shannon Diversity Index would be lower. The new car dealership would have an excessive abundant of the brand their company sold but they wouldn't have a wide variety of brands.
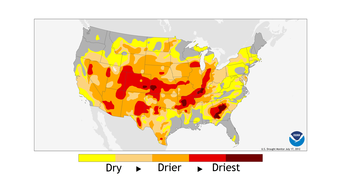
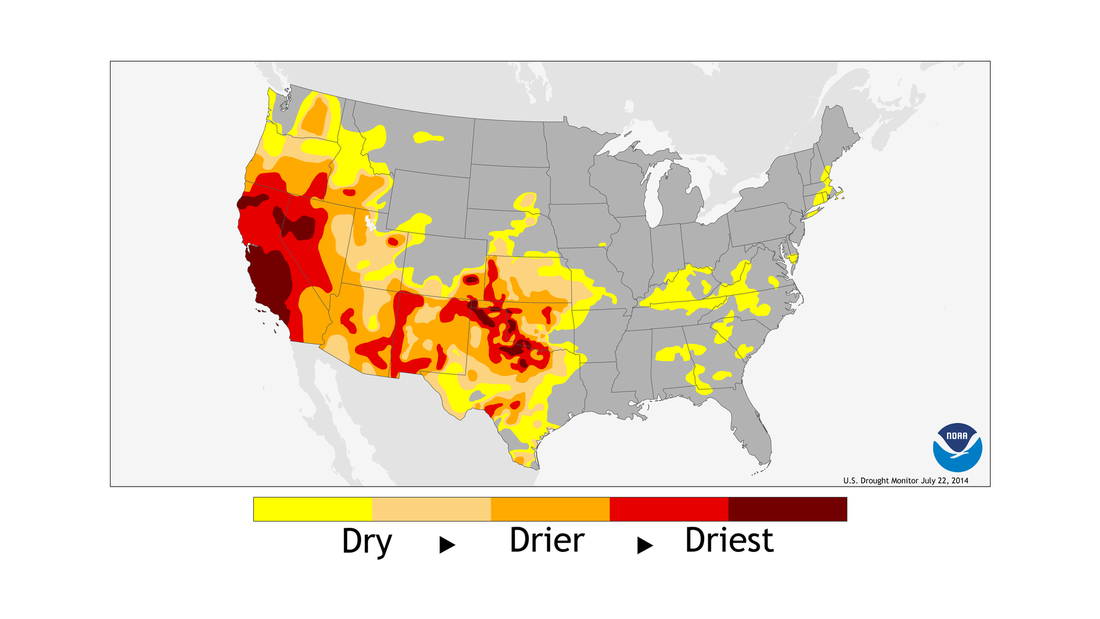
These two maps represent the drought just in a 2 year difference. The first map on the left was in 2012, the drought was spread through most of the U.S. The second map on the right was 2 years later in 2014 and the whole drought shifted towards California, and effected California badly.
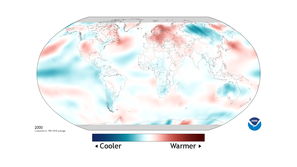
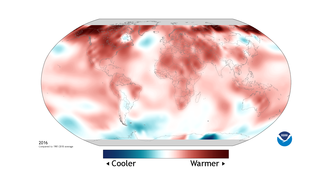
In these two maps it is a 16 year difference of the annual average climate. In the first map, it is much cooler than the second map which is much higher temperature. Huge difference, the weather is much warmer now days everywhere, not that many cool places.
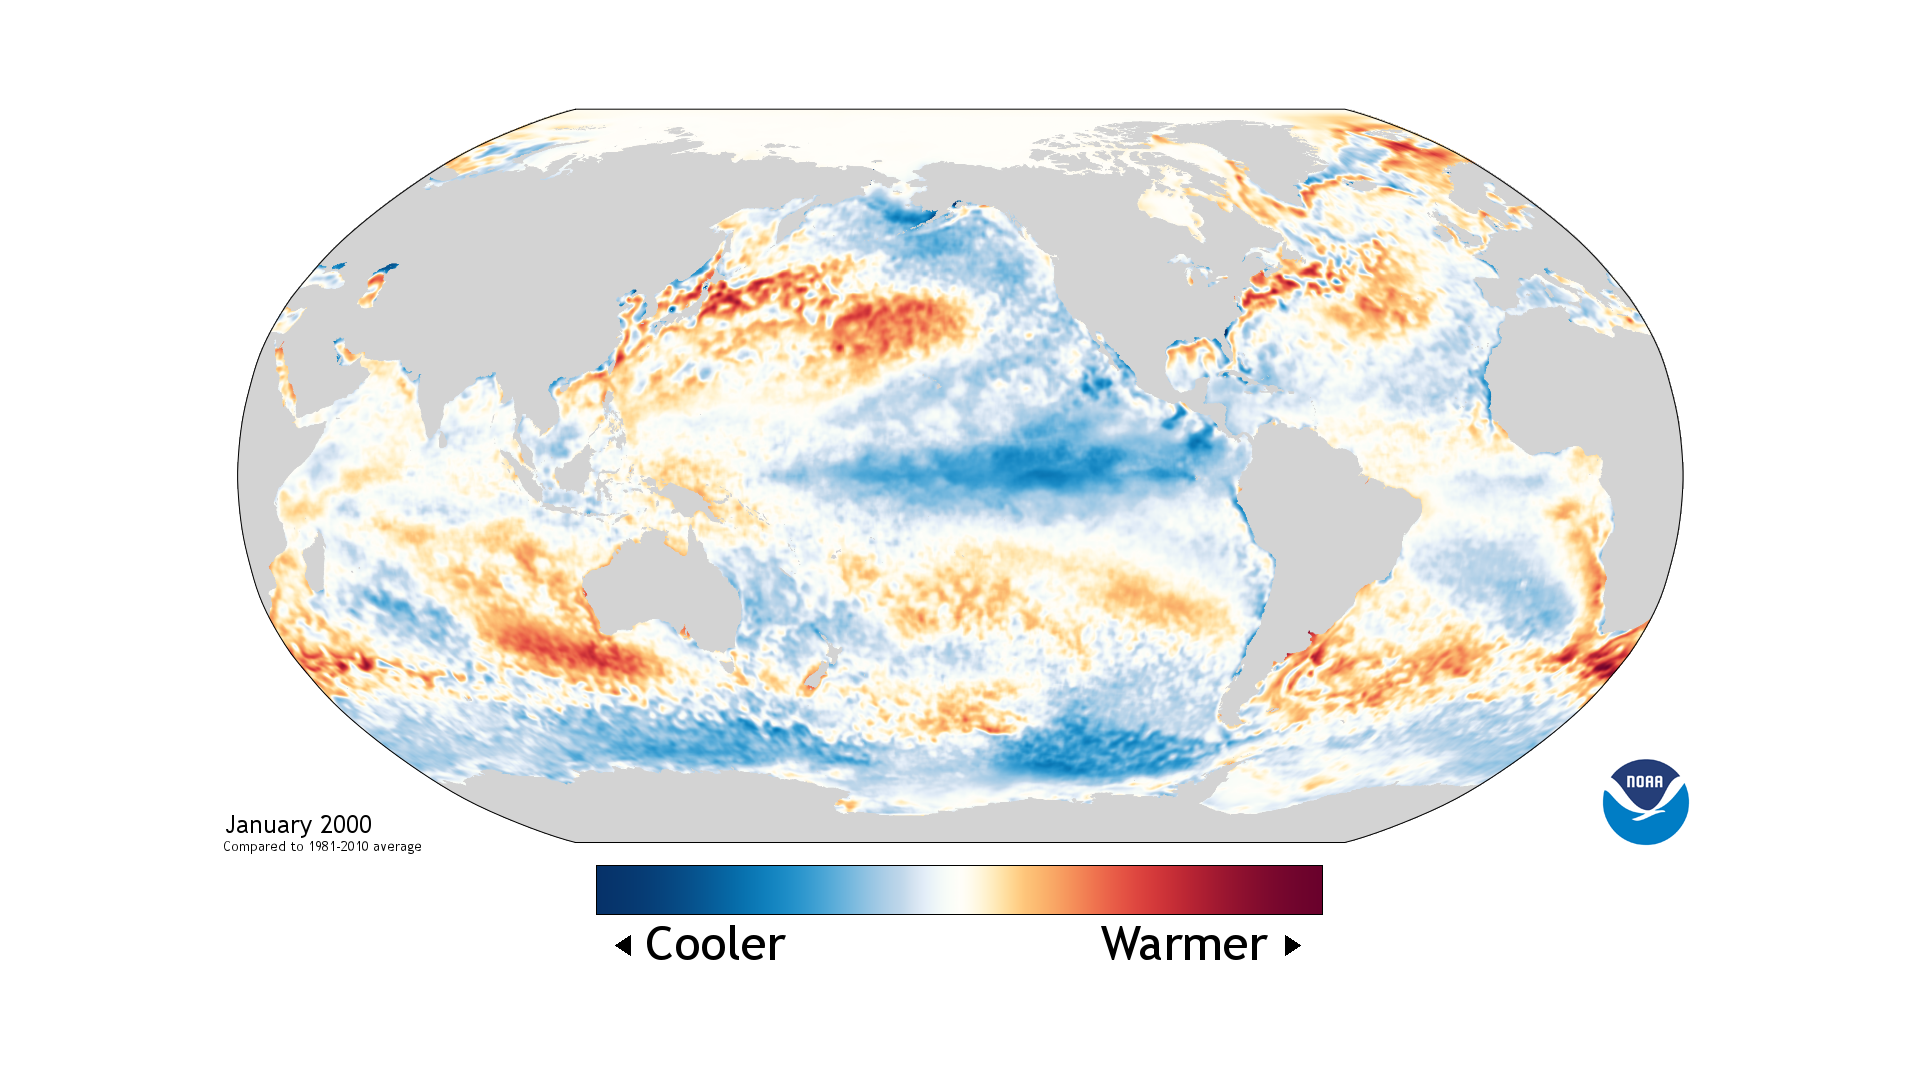
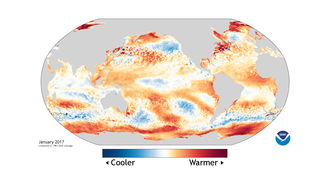
These two maps represent the difference between the oceans monthly SST anomaly global in seventeen years. The first map is from 2000 and the second map is from 2017. In the first map you can see how much cooler the ocean was, but on the second map it is much warmer, over the years the ocean temperature has changed dramatically.
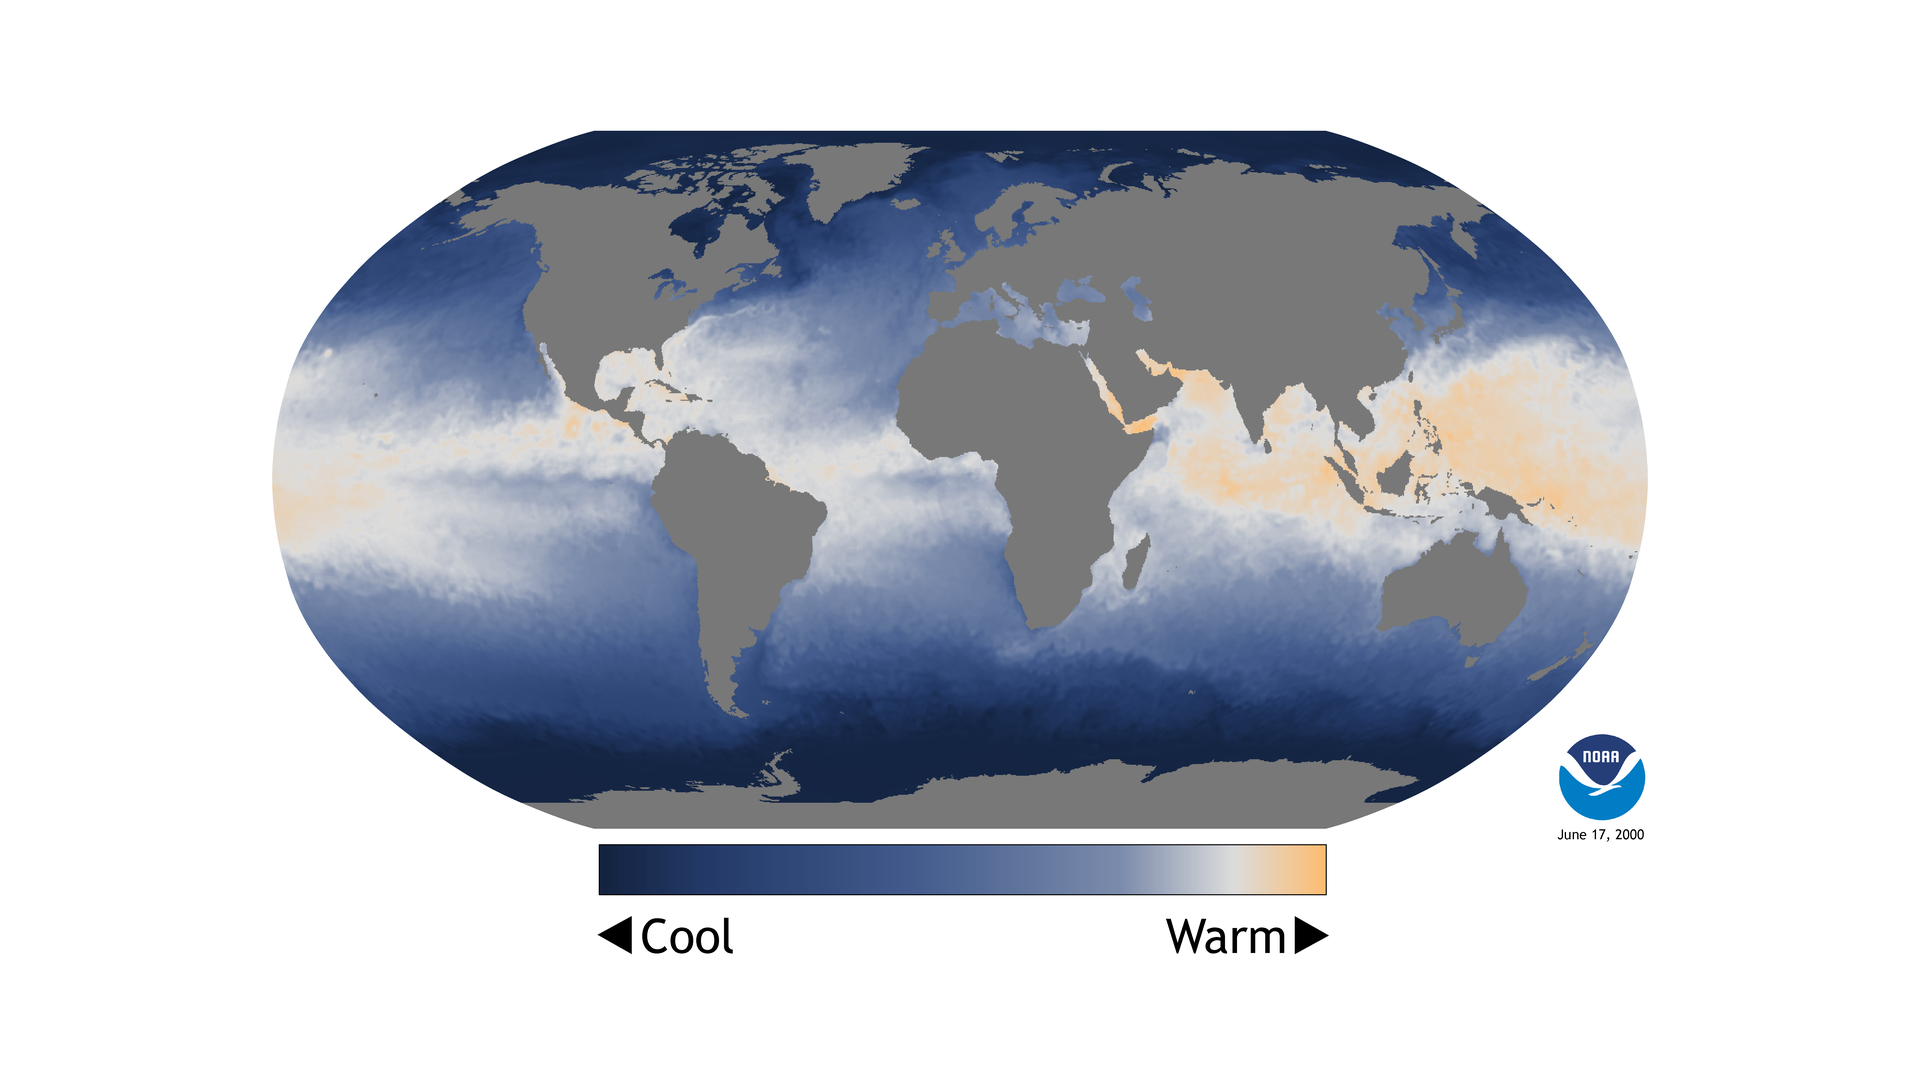
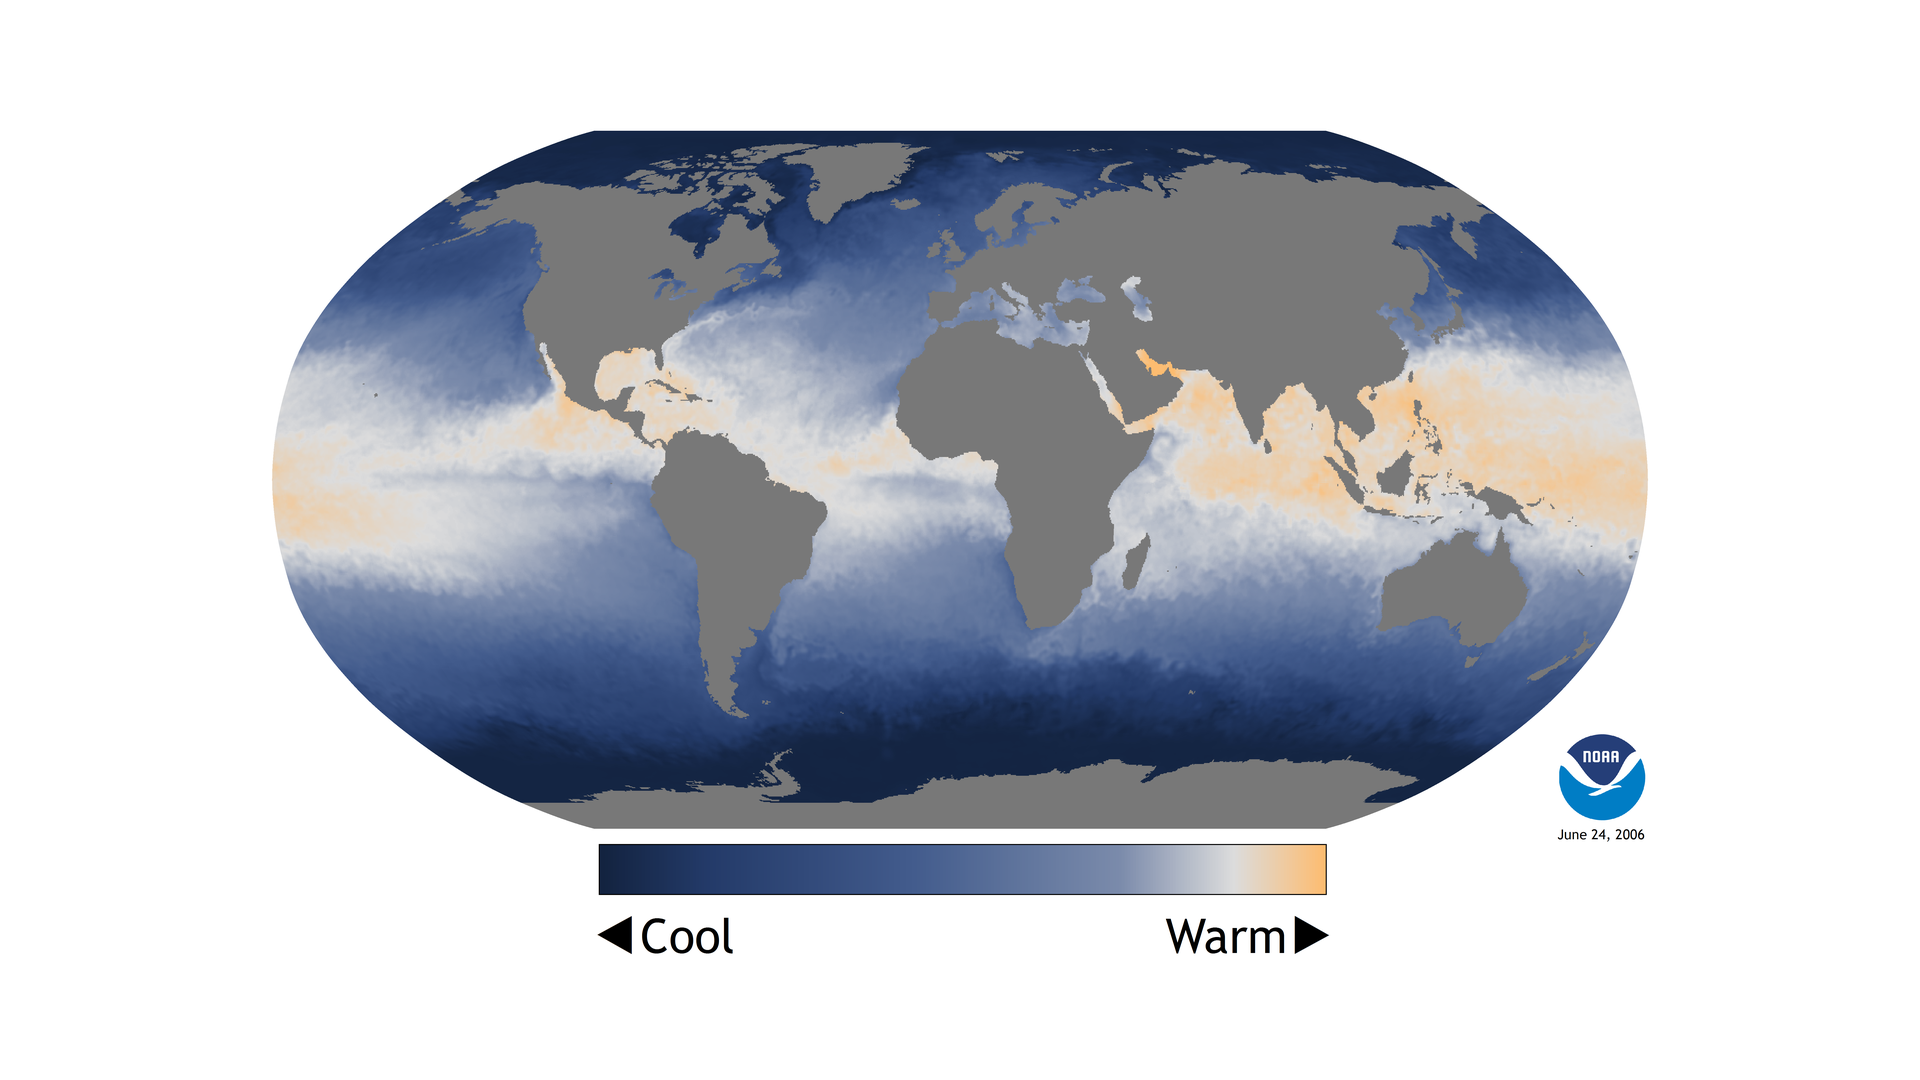
These two maps represent the sea surface temperature. The map on the left is from 2000 and the map on the right is from 2006, just a six year difference. Nothing has really changed in those six year the SST is just a tiny little bit warmer obviously, but it is a very small change.
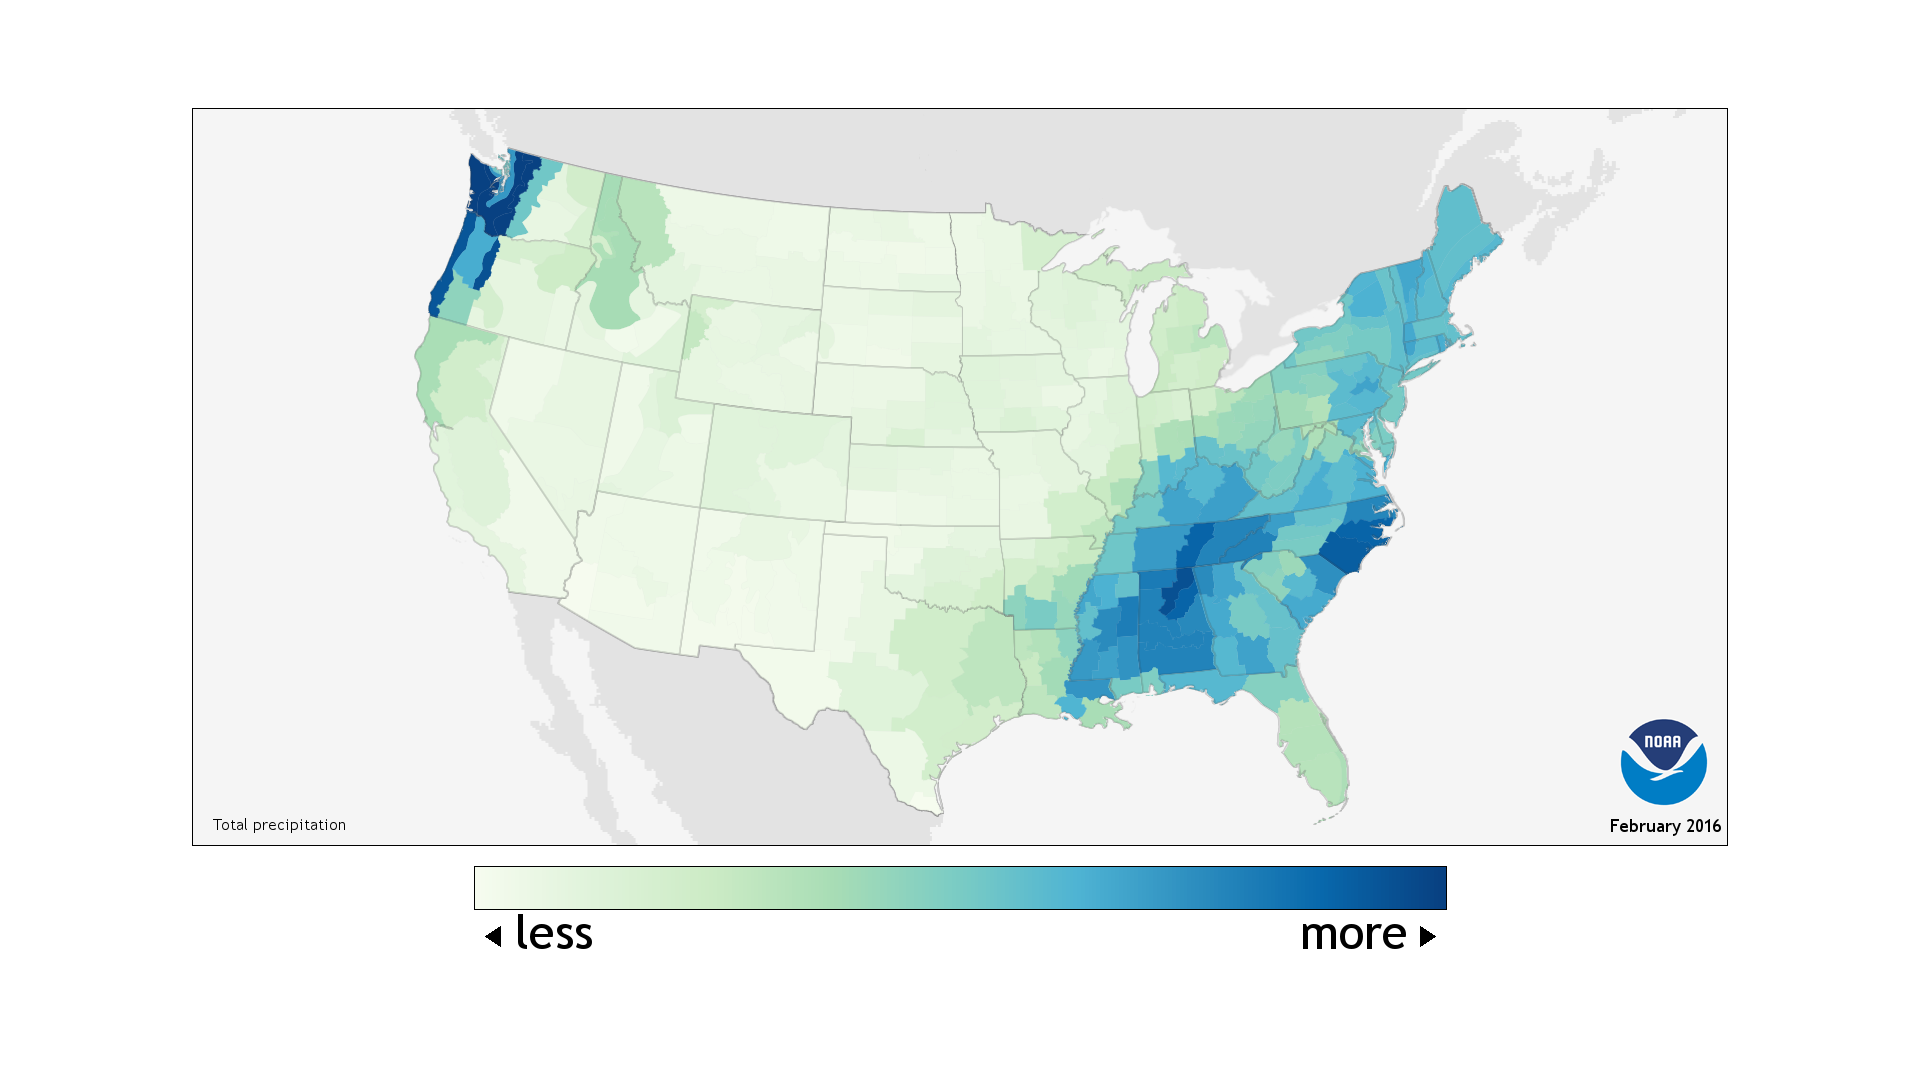
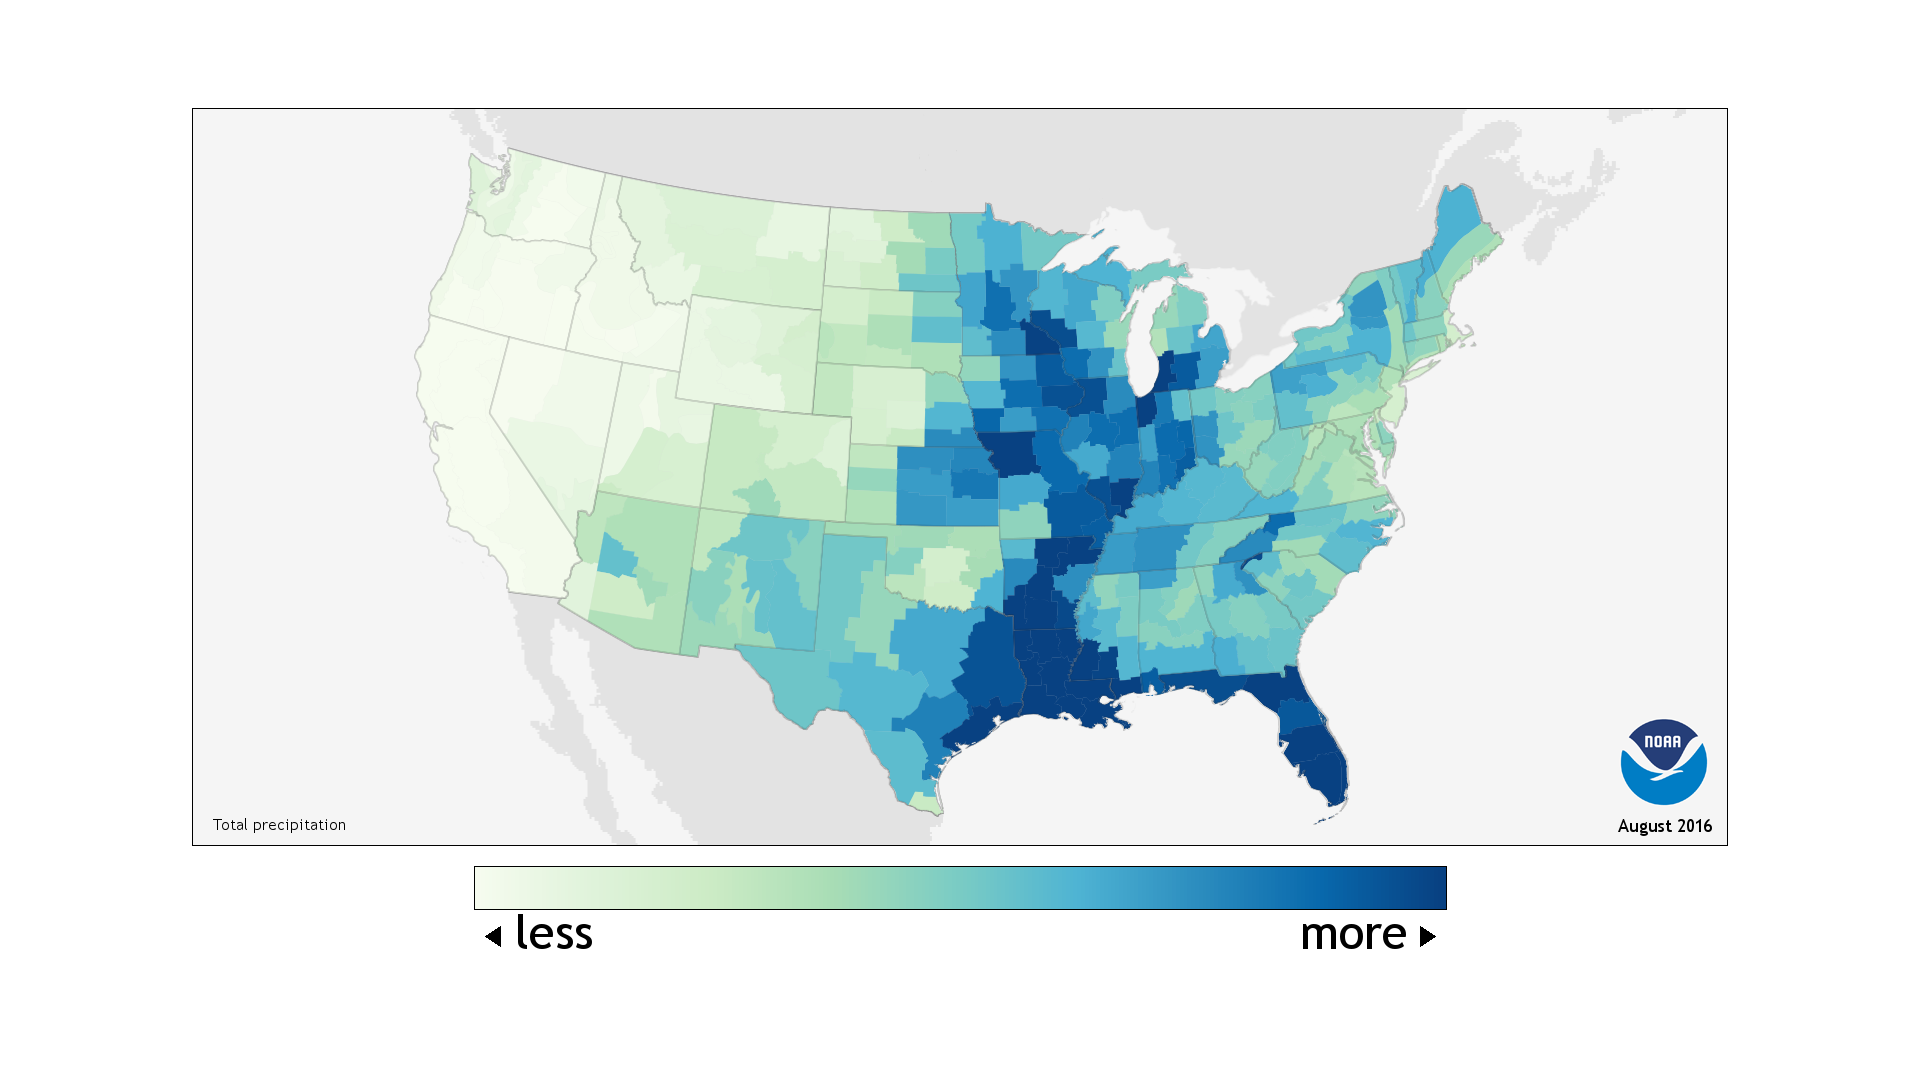
These two U.S. maps represent the total month precipitation. The map on the left was taken February 2016 and the one on the right was taken October 2016. There is a nine month difference and you can see how much it changes, in October there s way more rain, storms, hail, etc. Just five months later there is much less precipitation.
Click to set custom HTML
The population is stable because the amount of people coming and leaving Turlock is relatively balanced.
Population is slowly increasing because of all the job opportunities in LA.
The population is increasing because of all the new stores and houses being built which allows more job opportunities.
The population is declining due to people moving to different cities.
The population is declining because people from age 20-24 is being attracted to Moscow because of the University of Idaho.
The population is some what stable because of there is always numerous amounts of job opportunities In Chicago.
The population is slowly increasing because its a very famous city, it is the capital of Texas and it is the 11th most populous cities in the united states
|
AuthorWrite something about yourself. No need to be fancy, just an overview. ArchivesCategories |
 RSS Feed
